One Year Later: The UK's COVID Battle in Numbers
The winter of 2020 is one that few will wish to remember. The human cost of COVID has touched most of us in some way, while the insidious impact of lockdown has hit everyone hard. Despite a significant recovery in the latter part of the year, UK economic production still contracted an extraordinary 8% in 2020.
It is sobering to pass the one year anniversary since the first lockdown and apposite now to review the current COVID situation in the UK.
Back in November, tiered restrictions were just starting to bring the second wave of infection under control when a new variant emerged initially in Kent. This new variant proved to be up to three times more virulent and began to spread uncontrollably across the country. New cases soared to a peak of 80,000 in a single day in early January, one of the highest infection rates in the world.
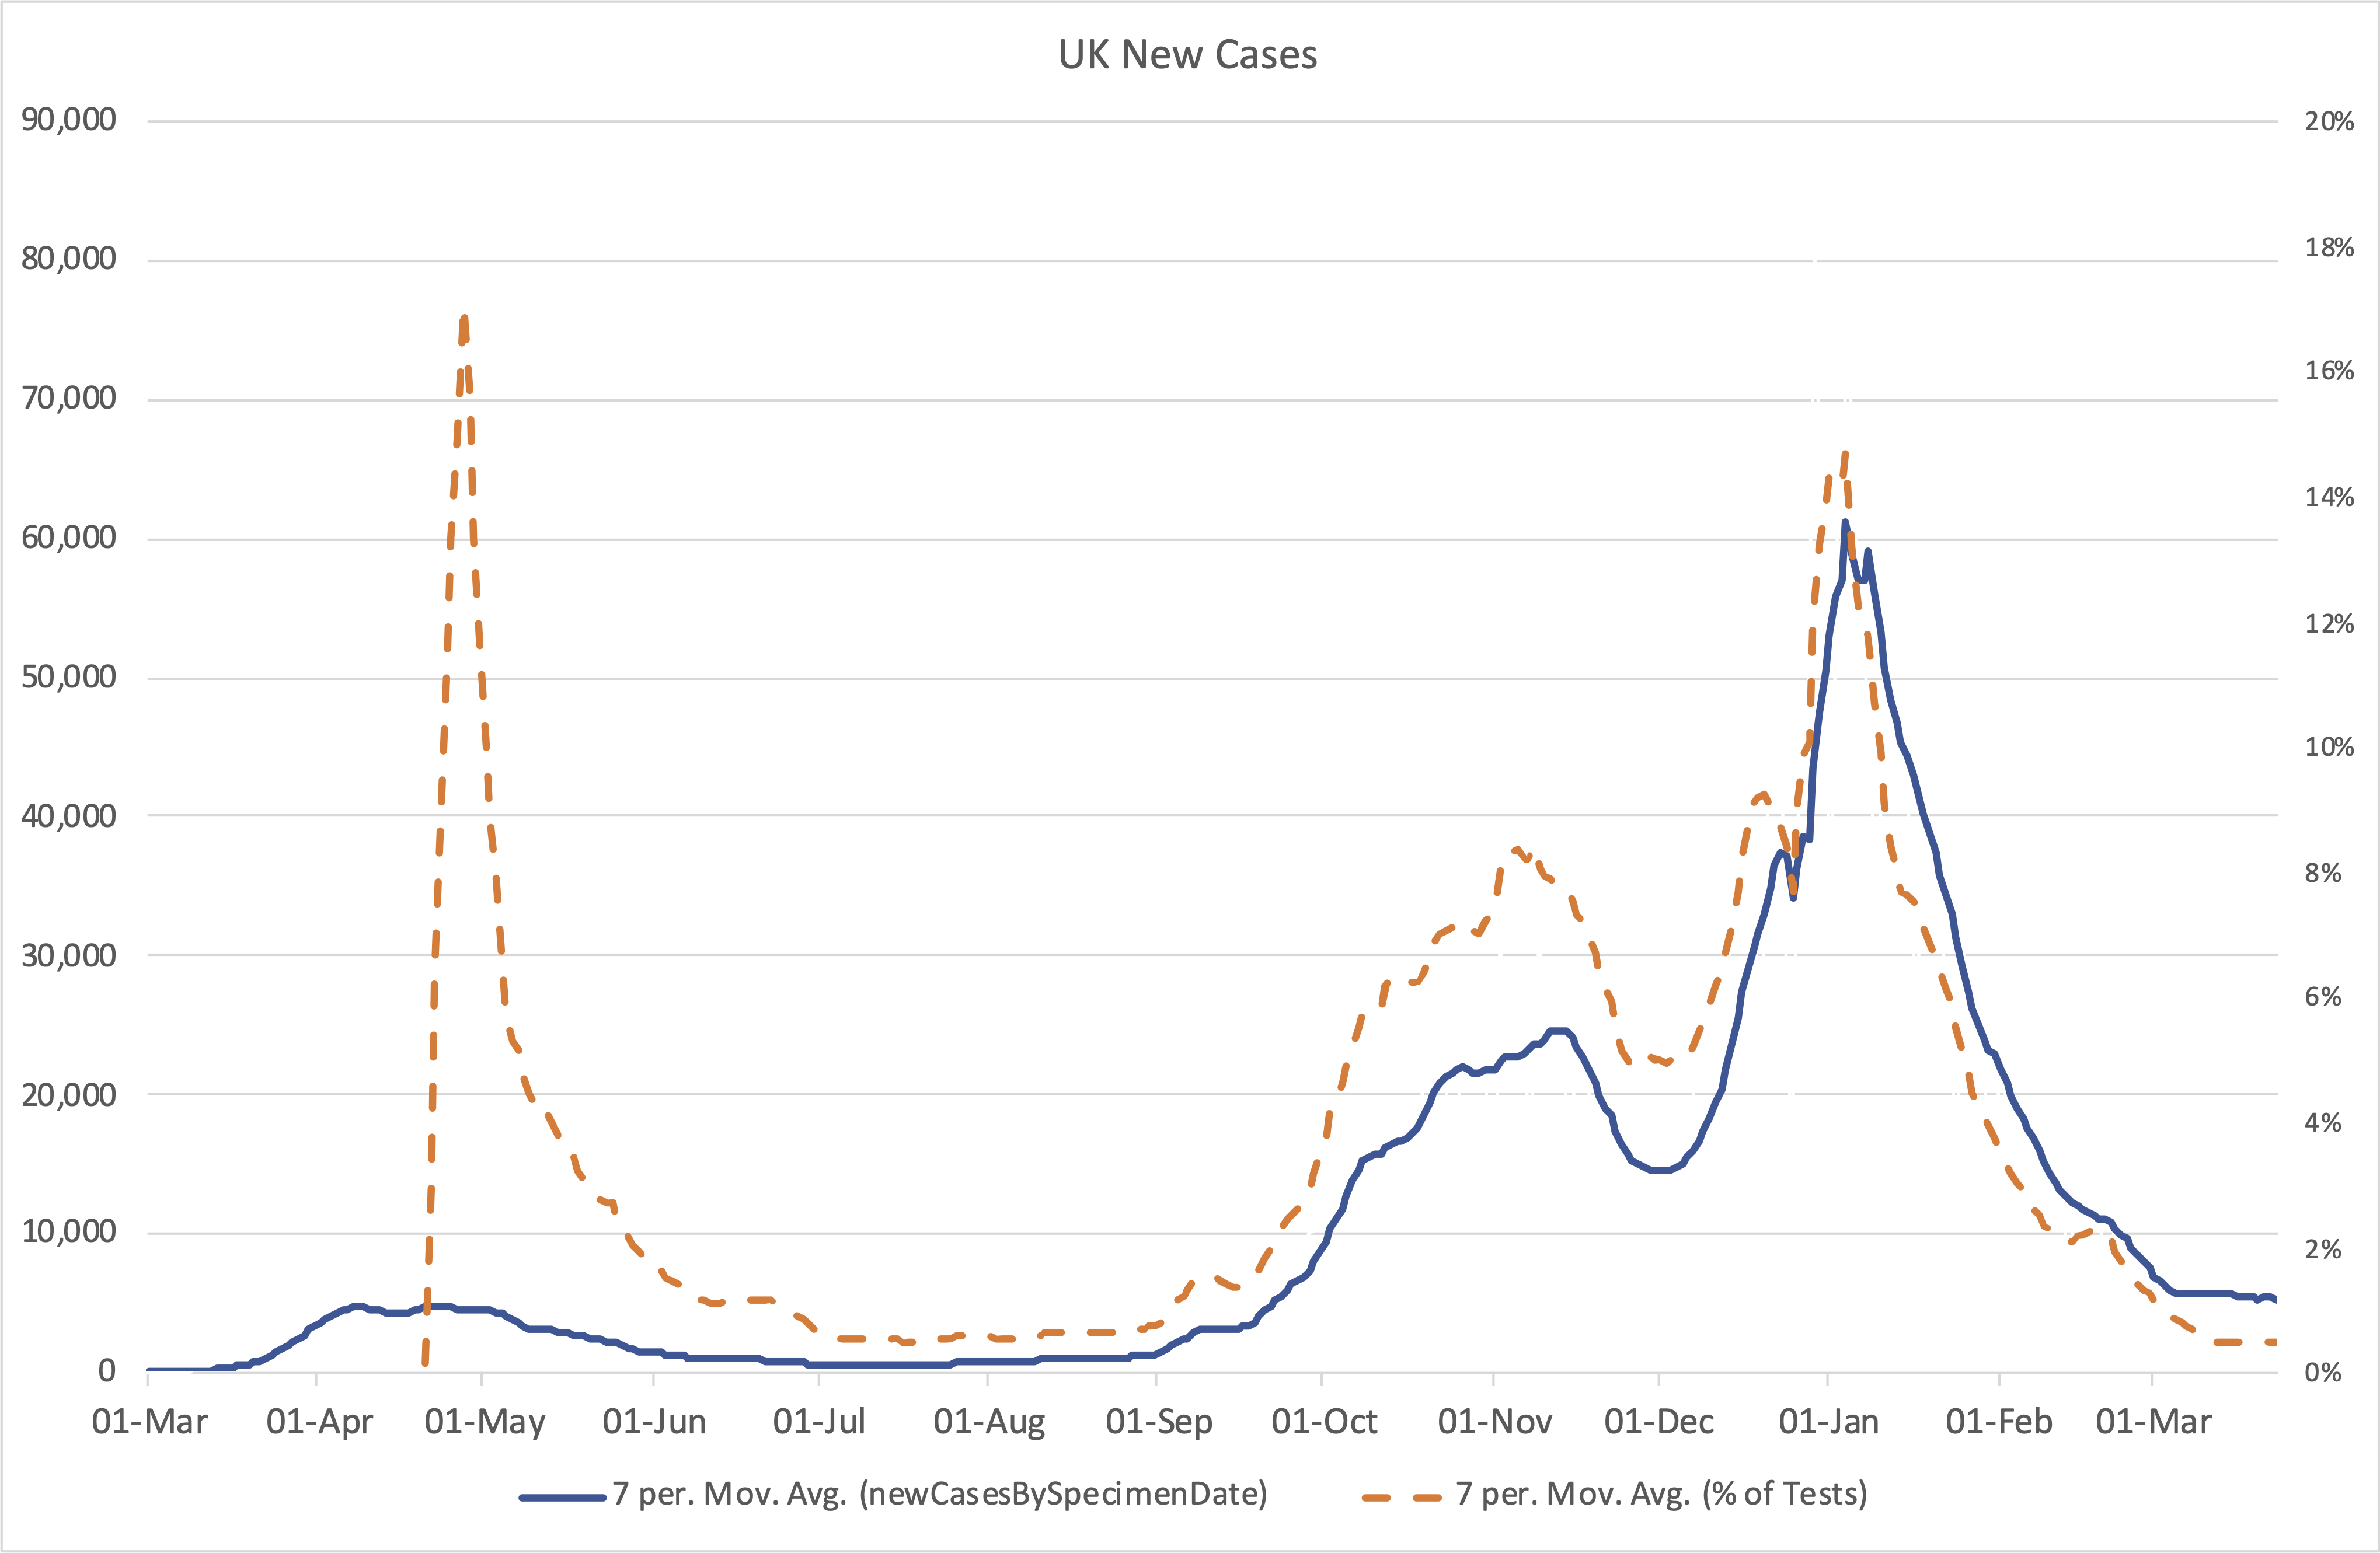
Since January, the picture in the UK has changed dramatically. The chart above shows the 7-day moving average of cases plummeting from 60,000 to around 5,000 a day currently. This may still sound like a high number, and indeed it's higher than the peak of the first wave in 2020; however, this overlooks another critical factor – the number of tests being conducted.
In April last year, the average number of tests was c30,000 a day, with nearly 18% of all tests returning positive. The testing rate now is regularly in excess of 1.8 million tests a day and the percentage of positive tests has fallen to just c0.3%, illustrated by the orange dotted line in the chart above. This is about as close to zero as it is likely to get while we are testing on such an extraordinary scale.
Thankfully, we see a near identical pattern when we look at hospitalisations and patients in ICU; this is illustrated in the chart below, with hospitalisations plotted on the left hand scale and ICU beds plotted on the right hand scale.
Unsurprisingly, the peak in hospitalisations came toward the end of January, about 3 weeks after the peak infection rate, with the peak in ICU patients about a week after that. Hospitalisations peaked at c40,000 patients or roughly double the peak from the first wave. Fortunately, ICU patients only modestly exceeded the previous peak, reflecting an improvement in the treatment options and patient outcomes.
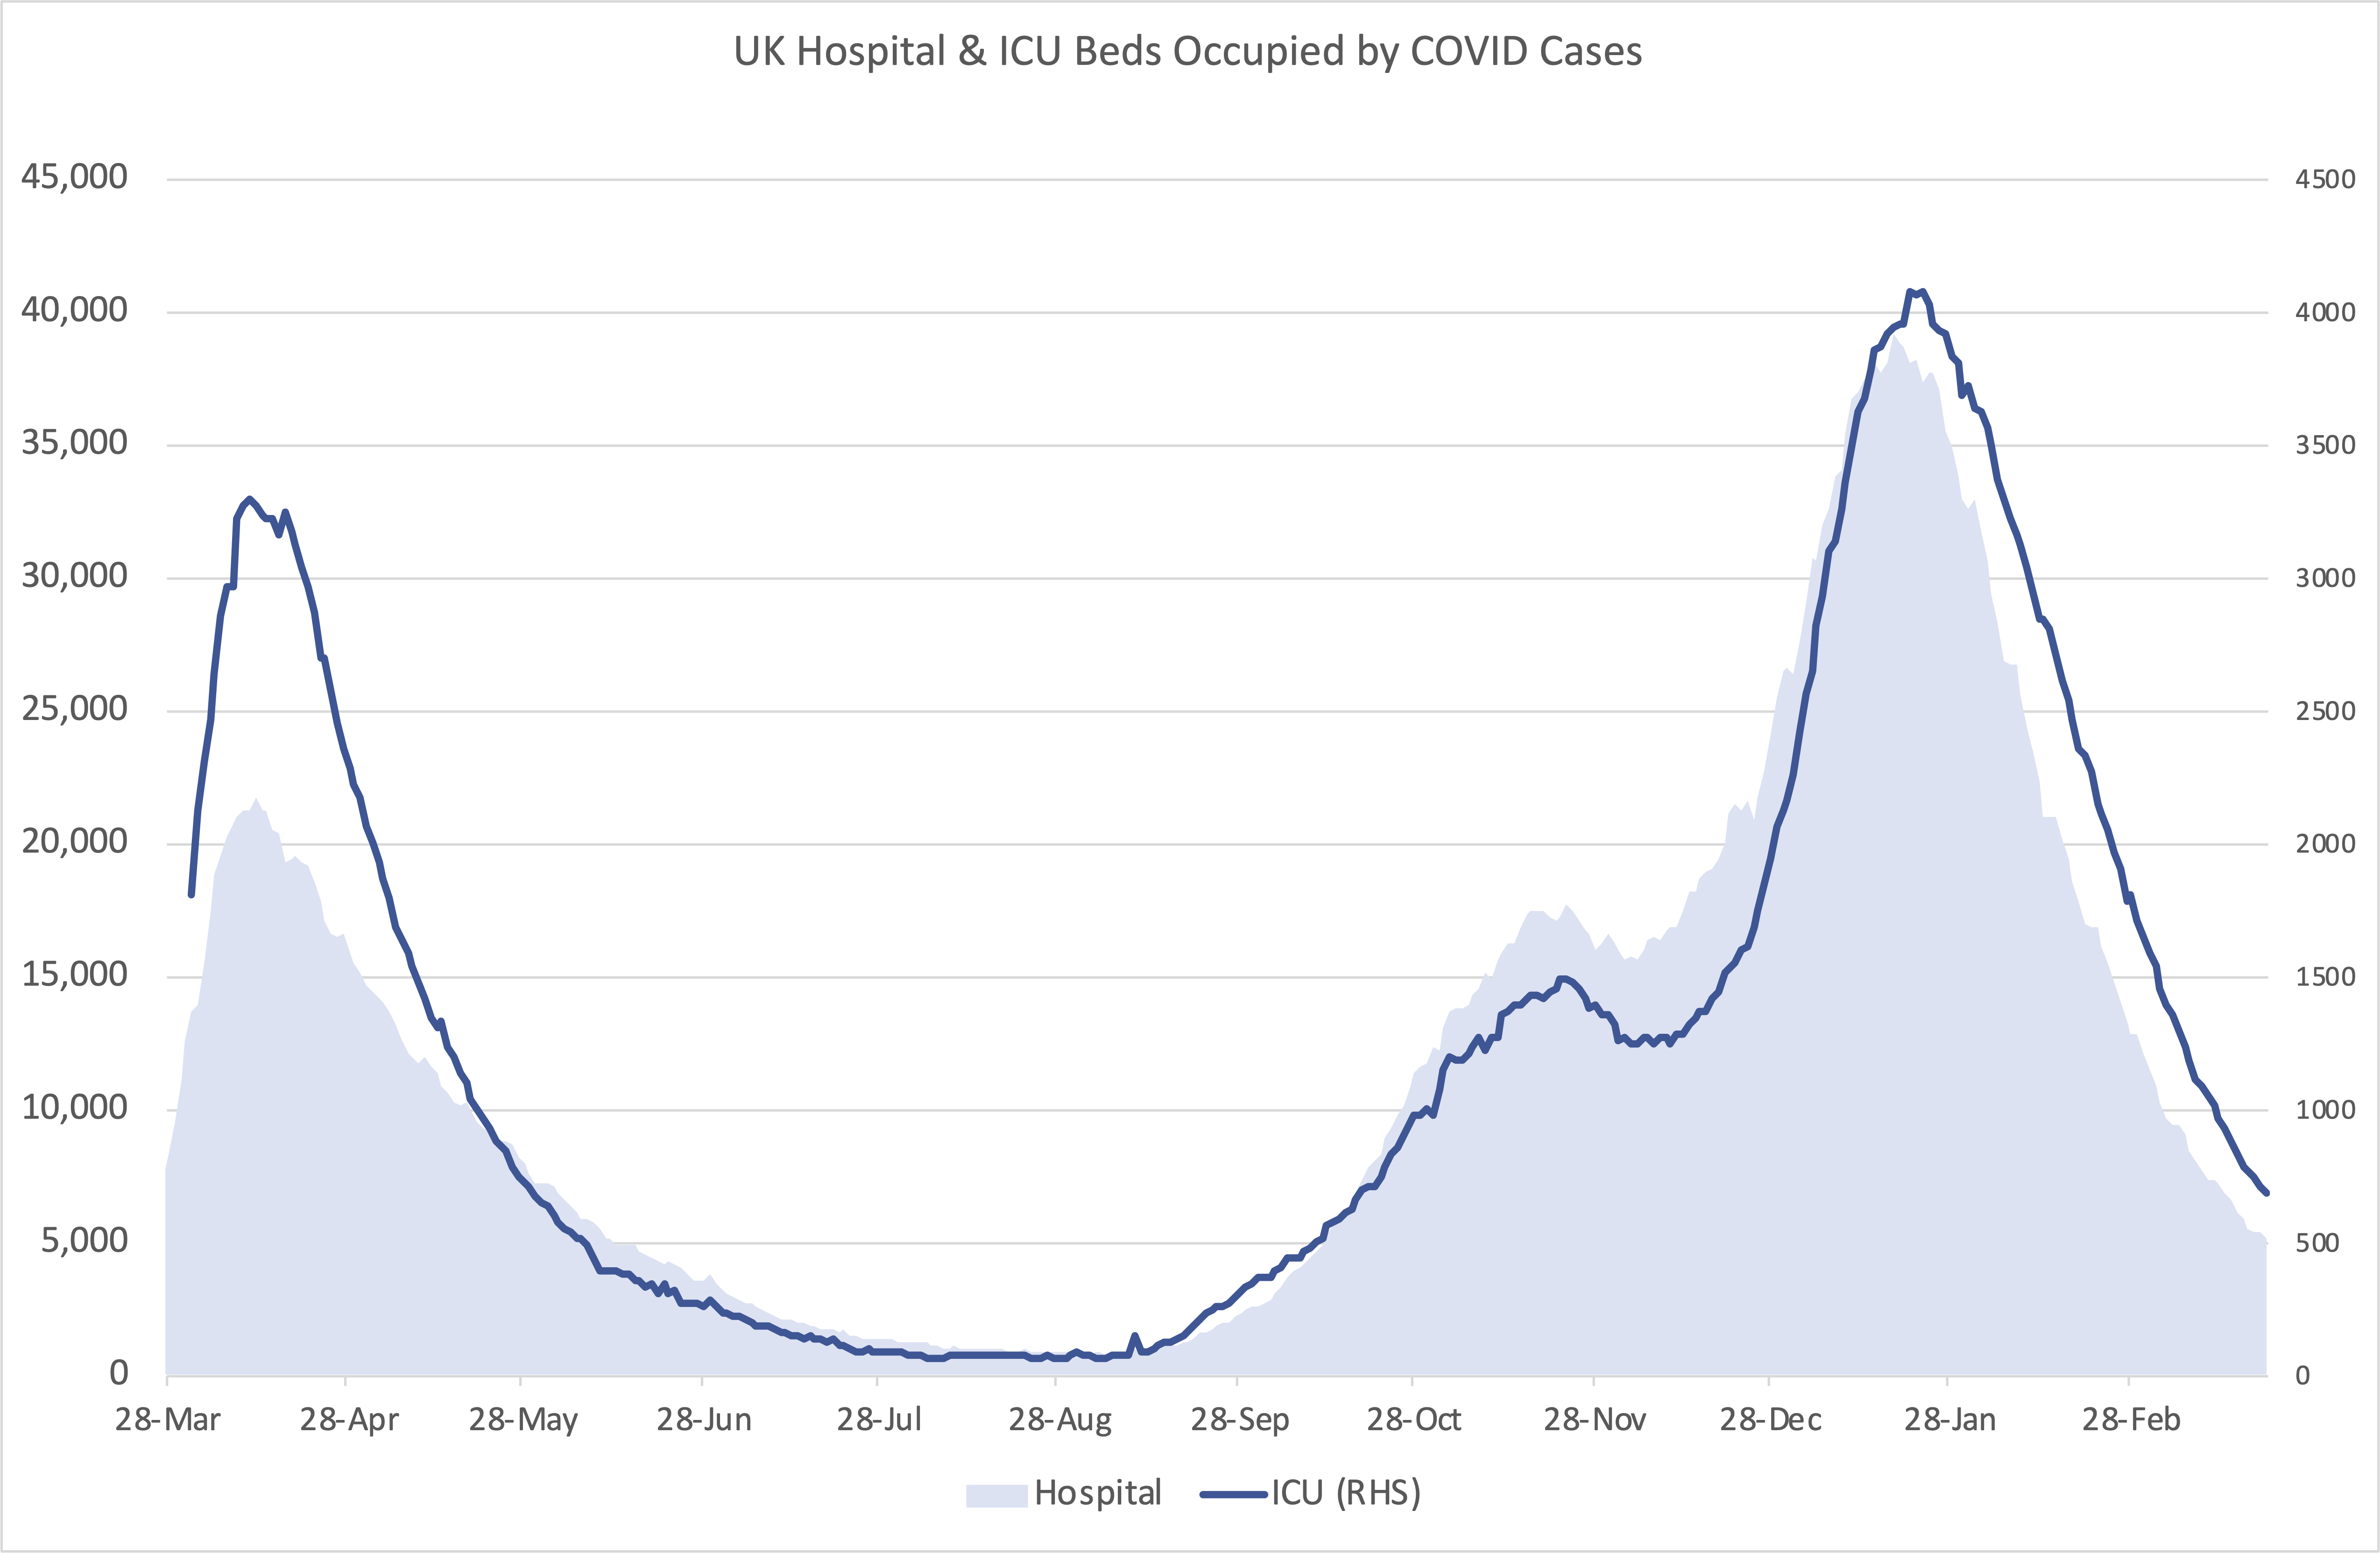
Since then hospitalisations have fallen dramatically, mirroring almost precisely the drop in new cases with around 5,000 COVID patients and 680 in ICU, although these numbers are likely to drop significantly further still over the coming weeks.
I am pleased to note that these improvements have also fed through to the UK’s mortality figures. The previous chart illustrates UK weekly mortality (the blue line) relative to the five year average (the grey range). The yellow shaded area shows the numbers where COVID 19 was mentioned on the death certificate.
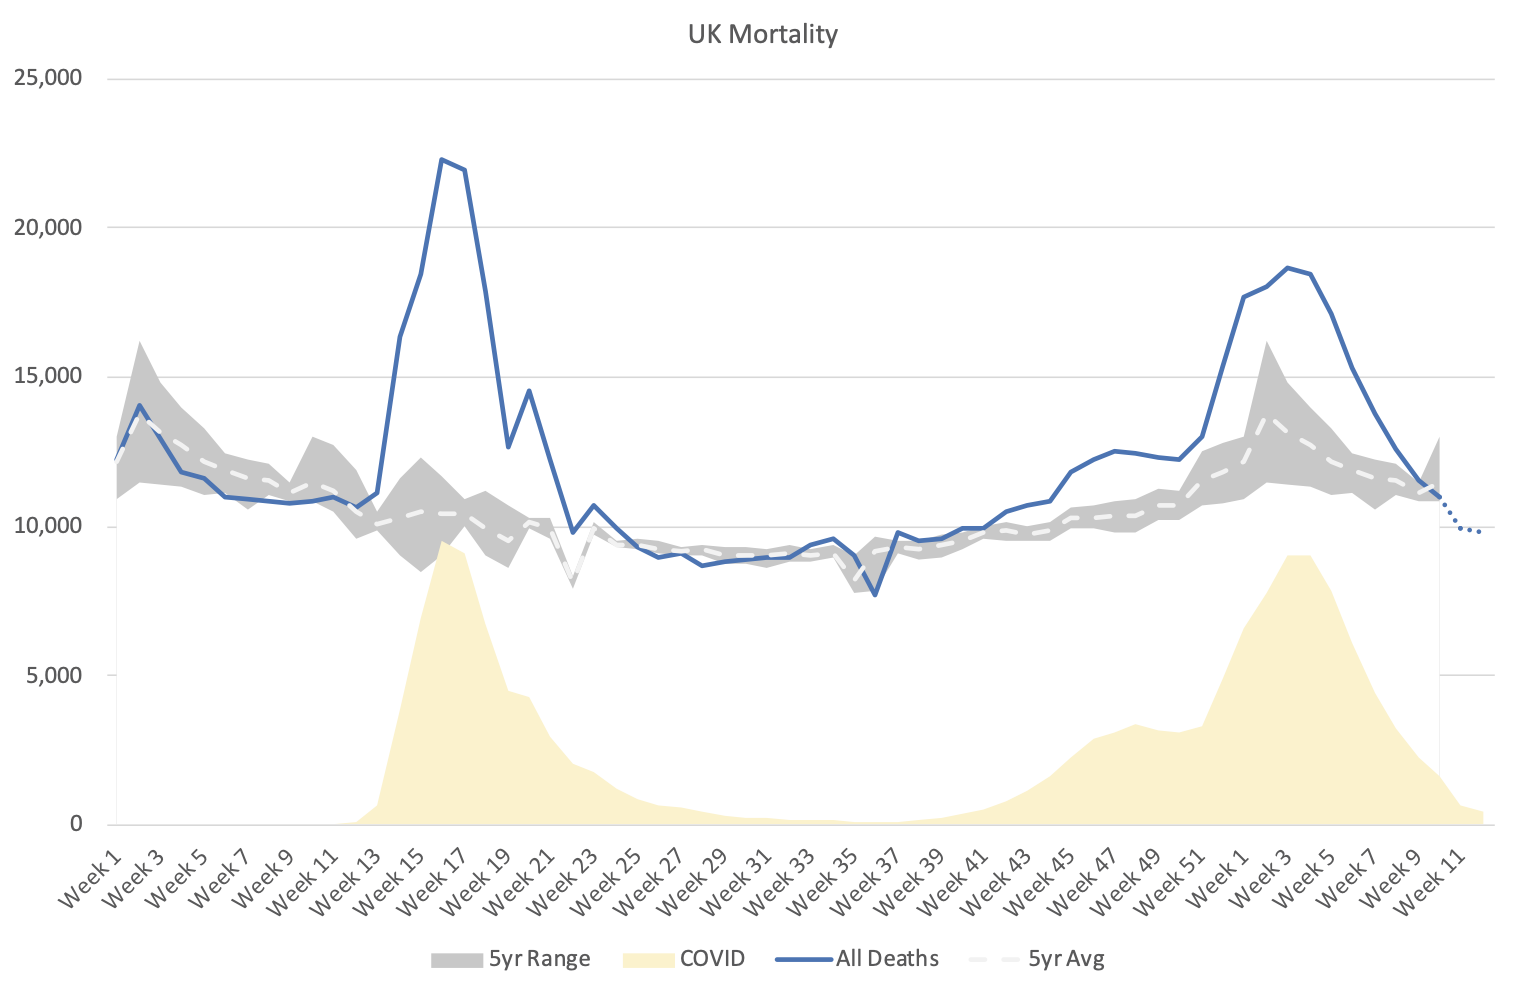
The impact of COVID is abundantly clear in UK mortality rates; however, it is also apparent that excess deaths, the level of deaths above average, was much higher in the first wave than over the winter. Indeed, whilst COVID related deaths have been of greater number during the second wave, the level of excess deaths, while significant, is not as extreme as we might have anticipated. It is likely that this is because COVID deaths have largely replaced other respiratory and flu related deaths during the winter months.
In line with falling case rates and hospitalisations, deaths from COVID have dropped dramatically this year to levels not seen since the summer. Indeed, deaths have fallen to such an extent that excess deaths have turned negative, meaning that mortality is now significantly lower than the five year average for this time of year. This is excellent news.
What has happened in the UK to result in such a remarkable turnaround and what can we expect over the coming weeks as a third wave of infection is growing in Europe? The answer is very clear and very stark; vaccination.
The UK has achieved a quite astonishing rate of vaccination roll-out, with around 5% of the population vaccinated every week since January. Despite criticism at the start, it is now accepted that delaying 2nd doses was the optimal strategy and at the time of writing, has allowed the UK to vaccinate close to 60% of the entire adult population that includes the top 10 most vulnerable risk categories.
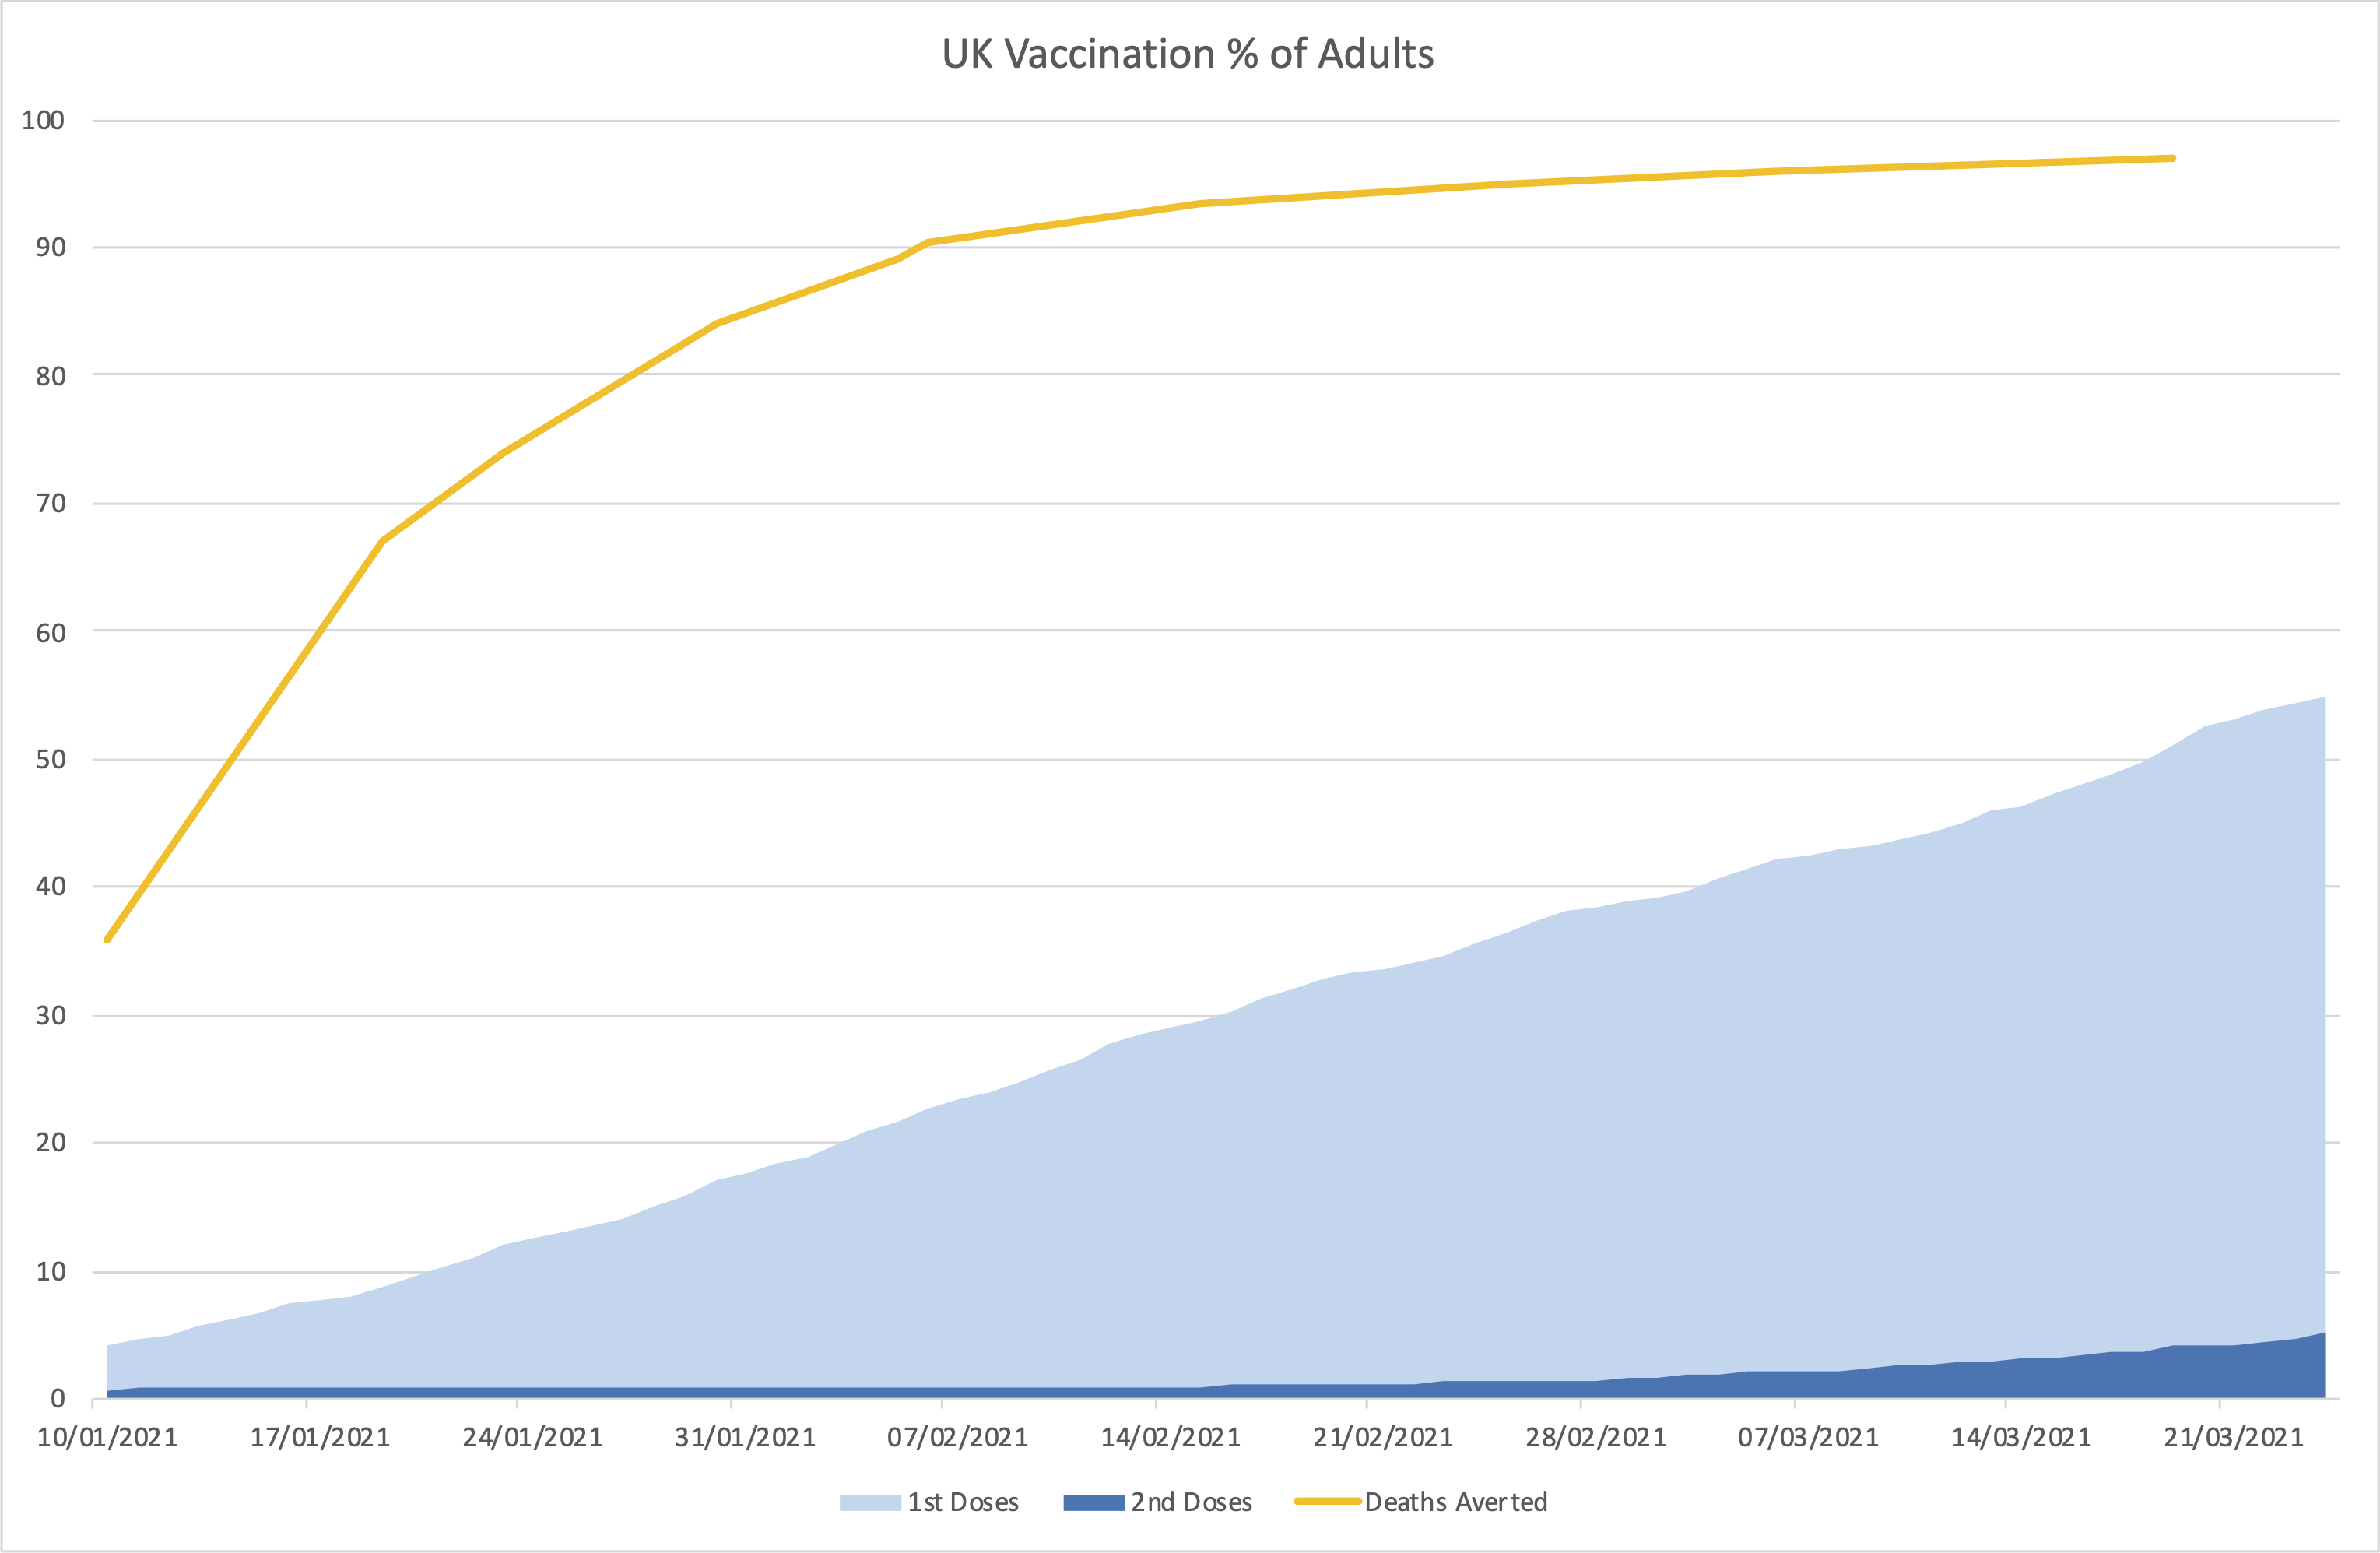
The impact this is having on cases, hospitalisation and deaths is illuminating. The chart above shows the percentage of the population that have received both 1st and 2nd dose vaccinations and we see this increasing steadily through the population. Above this the yellow line shows the estimated percentage of deaths averted by vaccination. This increased very rapidly as the most vulnerable groups received their 1st doses, passing the 50% mark as early as mid-January. By the middle of February this had increased to 90% and has now reached as high as 97% of projected deaths averted as a direct result of vaccination.
This is a truly extraordinary achievement and completely changes the outlook.
Governments will rightly move cautiously to unlock economies for fear of yet further waves of infection, but if vaccination proves as effective as these projections suggest then the prospects look good for the summer. The next few weeks will prove decisive for the UK. The level of infections is almost certain to rise as restrictions are gradually lifted, but the real test will be whether the rate of hospitalisations and ultimately deaths continue to fall as a proportion of cases.
Disclaimer: The views, thoughts and opinions expressed within this article are those of the author, and not those of any company within the Capital International Group (CIG) and as such are neither given nor endorsed by CIG. Information in this article does not constitute investment advice or an offer or an invitation by or on behalf of any company within the Capital International Group of companies to buy or sell any product or security or to make a bank deposit.