Risk and Return Relationship
The relationship between risk and return is a key facet of portfolio management and often misunderstood, with many under the assumption that this relationship is linear. I am hoping to remove the shadow cast over this particular area of finance and try to explain some portfolio theory and some of the ideas which are used in Capital International Group products like Prism and, more broadly, in the investment management industry.
Two common industry terms are ‘Beta’ and ‘CAPM’:
Beta is a measure of volatility and/or systematic risk. It is often used in the capital asset pricing model, which calculates the expected return of an asset relative to expected market returns using the beta and the risk free rate.
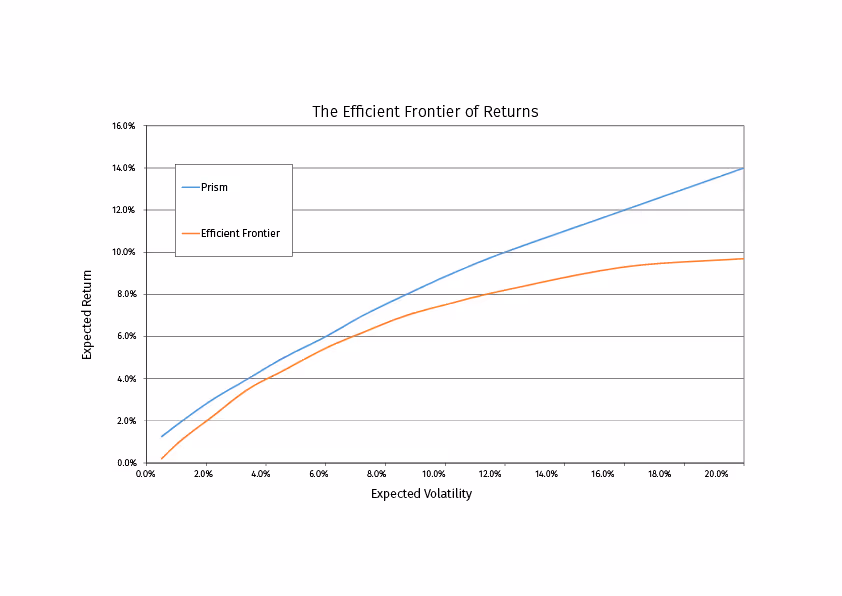
The capital asset pricing model (CAPM) is a model that describes the relationship between systematic risk and expected return for an asset. The basic premise is that all agents invest in a portfolio with the highest expected return per unit of risk (‘Sharpe ratio’), and leverage or de-leverage the portfolio to suit their risk preferences. This can be seen in Capital International Group’s PRISM product, where we use a traditional balanced portfolio as our central master investment strategy, and distribute the return based on an enhanced risk return relationship, which is better than one can traditionally receive in the market. The strategy works because both low-risk and high-risk investors help each other to achieve the enhanced return.
The risk return relationship in global markets has been examined at length in academia. Three of the most famous and early papers on this topic were Sharpe (1964), Lintner (1965) and Black (1972), who all believed that there was a significant relationship between beta and expected returns as per the CAPM. In 1992, Farma and French expanded on these studies, creating the 3-factor model (FF3). Although academics and investors alike believe risk and return have a significant positive relationship, there are contrarians who believe that there is a relationship between expected return and negative market risk premium.
Why is the CAPM important?
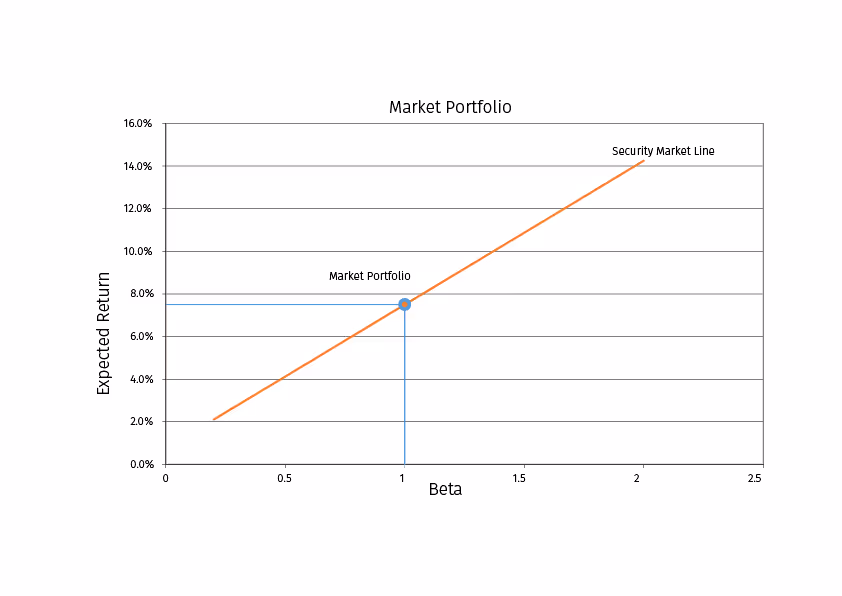
In short, the CAPM is useful in portfolio construction. It took the principals of Markowitz, expanded on them and highlighted two different types of risk specific and systematic. Specific risk or unsystematic risk can be significantly reduce through diversification. They then made the assumption that the “market portfolio” carries no specific risk. Through the market portfolio and the risk-free asset, an investor can create a portfolio based on their ‘risk appetite’. This allowed Sharpe and Lintner to define the premium investor’s demand for taking on risk in the market as opposed to a risk-free asset. This positive relationship is called the ‘market risk premium’, and by subtracting the risk-free rate from this, it provides the value investors need to satisfy the extra risk.
Ever since the introduction of the CAPM, financial professionals and academics have extensively tested it throughout global equity markets. The CAPM states that investors should be compensated in two ways; for the time value of their money and the risk (beta) incurred. The model helps calculate the return needed for the risk taken, or the return they should expect.
The model also assumes the proxy for risk is beta. This is a historical measure of the risk an investor is exposed to while holding a security and, although it cannot be determined by the theoretical market portfolio, it is typically calculated using a prominent market index (e.g. FTSE100, S&P500, FTSE all world) and widely accepted to be the best measure of systematic risk. Sharpe expanded on this by drawing a graph of the CAPM, with the security market line (SML). This graph depicts the linear relationship between expected return and beta. By plotting this and placing the beta and expected return of an asset on the graph, one can choose securities, which have a low beta relative to their returns.
However, the CAPM isn’t without its critics. Many academics believe that there is only a positive risk relationship in bull markets. Studies have been conducted criticising the CAPM, including those from the perspective of behavioural finance. Prospect theory (Kahneman and Tversky: 1979), the idea that losses and gains are valued differently, is often thought of as a substitute for expected utility. We can hypothesise that people choose a preference based on uncertain outcomes. One argument, which follows on from the concepts of prospect theory, is the possibility of a relationship between risk and return sensitivity to a target price point. This suggests that a company with a domain of gains tends to be risk averse, whilst in the domain of losses a company tends to take on risk.
Other studies have focused on accounting measures of risk and return, and these tend to prove a high correlation in bull markets but show that returns can be less correlated in bear markets. Ball and Brown (1968) were the first academics to publish a paper on the relevance of accounting on securities behaviour, and until Moon K and Badr E (1998), nobody had really elaborated on this relationship. Moon K and Badr E (1998) tested for a relationship between accounting (earning and cash flow) and stock returns, and found a very strong correlation in both up and down markets earnings betas (0.90) and cash flows (0.94).
Though it was found that the correlation between up and down market return was to be (-0.04), this was put down to stock returns being more ‘random’ than that of earnings or cash flows. Non-numerical data might also be a factor that effects the relationship. An example of such a market driver could be sector type or the state at which the market is changing, e.g. top or bottom of the market and the risk attitudes at that time.
Another criticism of the model is that it uses beta as a systematic risk measurement and is henceforth not inclusive enough but, having said that, academics and industry professionals still use market betas as measures of risk in many cases. There are also elements of convenience in using a single factor in the CAPM. Though it makes the model easy to compute and understand if there is no systemic risk or if it is deemed to not be an appropriate measure, it should not continue to be relied on.
Farma and French (1993) expanded the use of firm specific characteristics in explaining the return behaviour of different types of portfolios. The Farma and French 3-factor model is different to that of the CAPM as it uses two extra factors as well as the market risk. It includes a size premium because in their research they found that small firms tend to have, or require, a higher return than large firms. It also includes a value premium which shows firms which have high book values to market values might be undervalued in the market and you might earn higher returns. To this, like the CAPM, we add a risk-free return to require a higher rate of return. Farma and French (1992) documented that only 70% of portfolios could be explained by beta, and that the other 30% of returns are explained by some other factor.
Also in their paper, Farma and French provided strong correlation between size and book to market ratio on stock returns. In their univariate and multivariate tests, they found a significant positive relationship book to market and a negative relationship between that of size and return. They found that ‘growth’ or ‘glamour’ stocks grew fast in the first few years, but as soon as the growth rates became similar to that of the value companies, they started to underperform. It was found that the high book value to market value stocks were the main driver for explaining more of the returns, and that value stocks weren’t inherently riskier than growth stocks, and in addition, had the added benefit of performing fairly in bear markets.
Though FF3 might be able to better explain return, it is worth noting that it relies on a positive risk return relationship (the same as CAPM), and uses historical data to forecast future returns. The empirical success of the FF3 model has defiantly challenged research to explain the underpinning of the model. However, the model is arguable and still only significantly performs better in 10% of cases.
Simpson and Ramchander (2008) found that in 58 out of 585 instances, the FF3 model performed more accurately than the CAPM. Though adding more variables adds more errors into the model, it is significant that the 5-factor model (FF5), which adds profitability and quality factors, might provide a better risk-return relationship. Simpson and Ramchander (2008) mention that they believe it is superior to the FF3 in preliminary studies, but note that there aren’t many direct studies comparing this to the CAPM and the risk return relationship as of yet.
While most of these studies are conducted on different markets, it must be pointed out that most of them were also tested over a short time period (5 years in comparison to Farma and French [1992] conducting their research over 50 years). However, a 5-year time horizon is actually more realistic for investors and possibly more ‘real world’. This shorter time horizon might mean that more than 50% of the study is conducted at a time of negative risk premium.
In Pettengill et al (1995), the authors analyse the assertion that beta has no systematic relationship with returns when just thought of in a positive market premium concept, although they also theorise that an inverse relationship is predicted between realised returns and beta when the realised market returns fall below the risk-free rate. A relationship between beta and returns is thus established by acknowledging a positive and negative market premium. Johnson’s findings (1994) was similar though not identical. He emphasised the absence of a positive correlation between risk and return for an above target, whereas below target banks it showed a significant negative correlation. Additionally, Jegers (1991) observed the relationship between risk and return in Belgium companies, and found a similar negative correlation in the performance when the return was below the mean return on the industry.
Isakov (1999) following the Pettengill approach and established that in the Swiss stock market from 1983-1991, the beta was directly related to both positive and negative returns. However, Fletcher (2000) suggested that the significant relationships can only be seen in periods of positive market risk premium whereas the relationship is insignificant in times of negative risk premium.
The CAPM and FF3 can also be used and tested against other benchmarks rather than just against market returns. Simpson and Ramchander (2008) compared the relative efficacy of the FF3 and the CAPM to predict returns in five different contexts: consumer demand, inflation, interest rates, economic growth and real estate. This appears to have provided a better benchmark than market returns, as the stipulations of each of the academic studies are all very different. Consumer demand is a central influence on the economy, and was predicted better by the FF3 model rather than the CAPM.
The same trend can be witnessed throughout all the variables except in interest rates. We theorise that this may be because announcements relating to interests rates are relatively controlled by using either of the two models.
Selvam and Gayathri (2010) concluded that correlation between total systematic risk and expected returns in their chosen portfolio is 0.98. They also compared portfolio beta and expected returns. which was 0.99. This shows that a well-diversified portfolio can be a substitute for a market index, and that a portfolio made by an individual or managed professionally will generally be related to the market portfolio, making the beta relevant to most portfolios.
In my opinion, beta only plays a significant role in markets that are efficient. When the market is either not acting as efficient as it should or there are political or other more complex risks, beta will not play as much of a vital role. As most markets are described as ‘semi-strong’, it can be said that unless a study is conducted over an extremely long length of time, a relationship might not ever be apparent. The cited literature firmly suggests that while beta does play an important role in predicting market return, their relationship is by no means perfect. Given the importance of various models and methods used for estimation in financial decision-making, it is surprising that not so many academic studies have focused on the shortcoming of beta as an efficient predictor! Despite its flaws, the CAPM and FF3 are still some of the only models to evaluate the risk return relationship in finance, and it is unlikely that they will be replaced in the near future.
Disclaimer: The views thoughts and opinions expressed within this article are those of the author, and not those of any company within the Capital International Group (CIG) and as such are neither given nor endorsed by CIG. Information in this article does not constitute investment advice or an offer or an invitation by or on behalf of any company within the Capital International Group of companies to buy or sell any product or security.